Introduction: The eternal debate between active and passive management
Since the emergence of passive funds in the 1970s, the debate over the superiority of active funds has fueled discussions in the financial world. Advocates of active funds tout their ability to generate alpha, i.e., risk-adjusted outperformance, through manager talent. Conversely, proponents of passive funds highlight their simplicity, lower fees, and ability to mechanically replicate benchmark indices.
This article aims to answer a crucial question: do active funds truly generate sustainable alpha? To answer this, we focus our analysis on the Global Growth Equities category, which has dominated global equity markets over the past two decades.
Base 100 Performance - March 2010 to November 2024
Here we study active funds rated 5 stars on EnvestBoard, representing the top 10% of performers over three years, compared with an MSCI World Growth tracker.
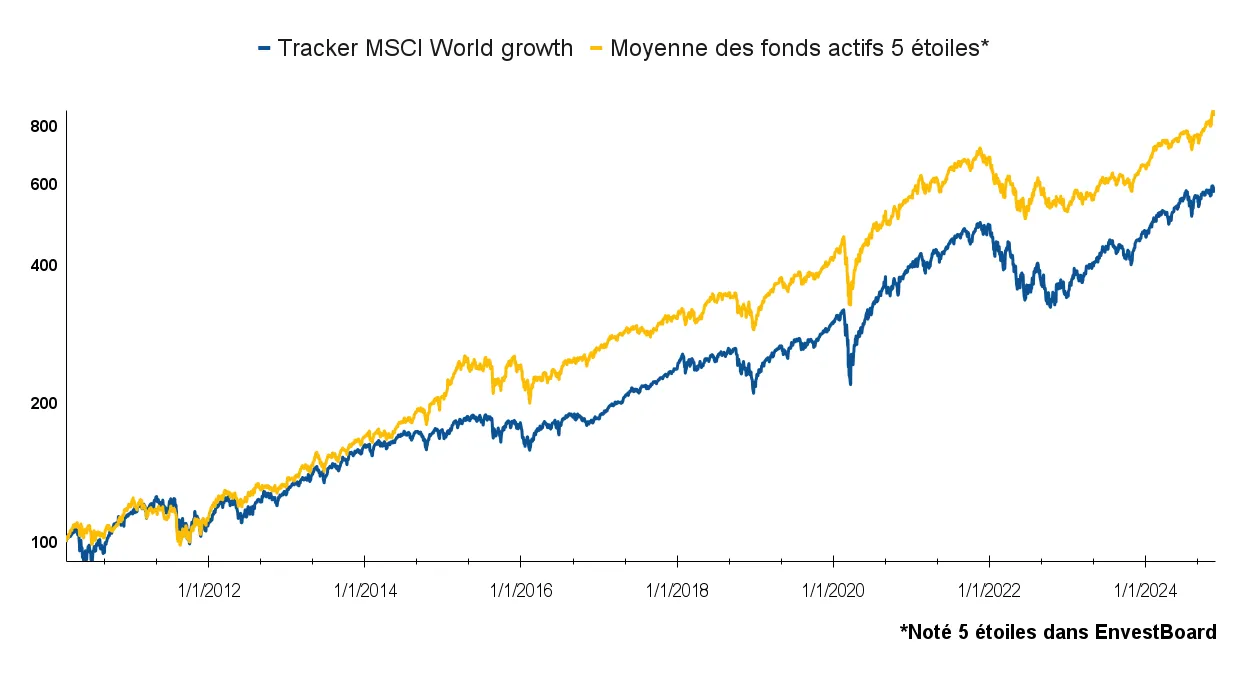
| MSCI World Growth Tracker | Average of 5-star active funds | |
|---|---|---|
| Annualized Return | 12.8% | 15.7% |
| Volatility | 16.1% | 14.4% |
| Sharpe Ratio | 0.8 | 1.1 |
| Average Ongoing Charges | 0.39% | 0.88% |
Our methodology is based on more than 24 years of data, without bias in favor of active or passive funds.
1. Active Fund Outperformance: Promising Results
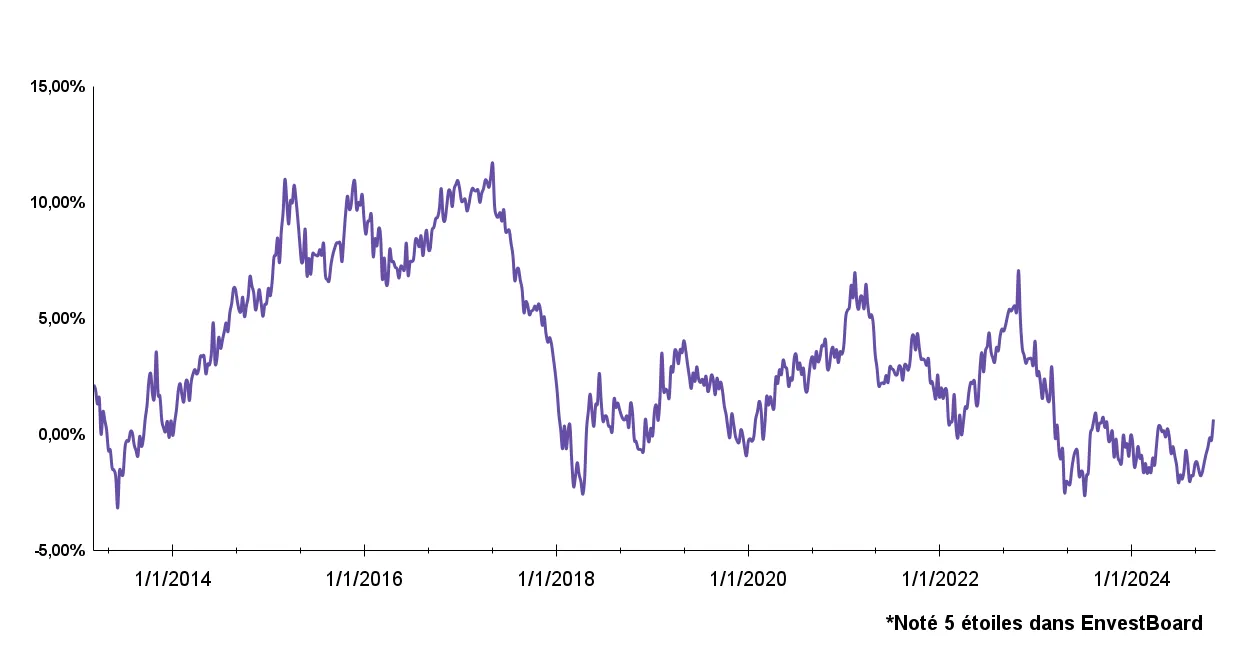
Average 3-year rolling annualized outperformance of 5-star active funds vs World Growth trackers
| Average | Max | Min | |
|---|---|---|---|
| 3-year Outperformance (annualized) | 3.4% | 11.7% | -3.2% |
Over the 3-year rolling periods studied, 5-star active funds show significant average outperformance over the MSCI World Growth tracker: on average +3.4%, at best +11.7% and at worst -3.2%. Moreover, in 80% of observations it is positive.
This finding seems to indicate real added value from active management. However, a simple outperformance analysis can present an oversimplified view: a significant portion of this performance may result from increased market exposure (Beta) rather than genuine management skill (alpha).
In other words, the outperformance could simply reflect additional risk-taking without real diversification. To dispel this ambiguity, we must therefore analyze alpha, a more robust measure of added value independent of market risk.
2. Alpha: The True Added Value of Active Managers
Alpha, which measures market risk-adjusted performance, is a key indicator for assessing whether active fund managers generate genuine diversification and quality management.
| Average | Max | Min | |
|---|---|---|---|
| 3-year annualized outperformance of active funds* | 3.4% | 11.7% | -3.2% |
| 3-year annualized alpha of active funds* | 5% | 14.1% | -2.1% |
Data from the EnvestBoard tool shows that the average alpha of active funds remained positive in 97.5% of observations, compared to 80% for outperformance. This indicates that even when active funds underperform their tracker, they often provide more effective risk management and better diversification.
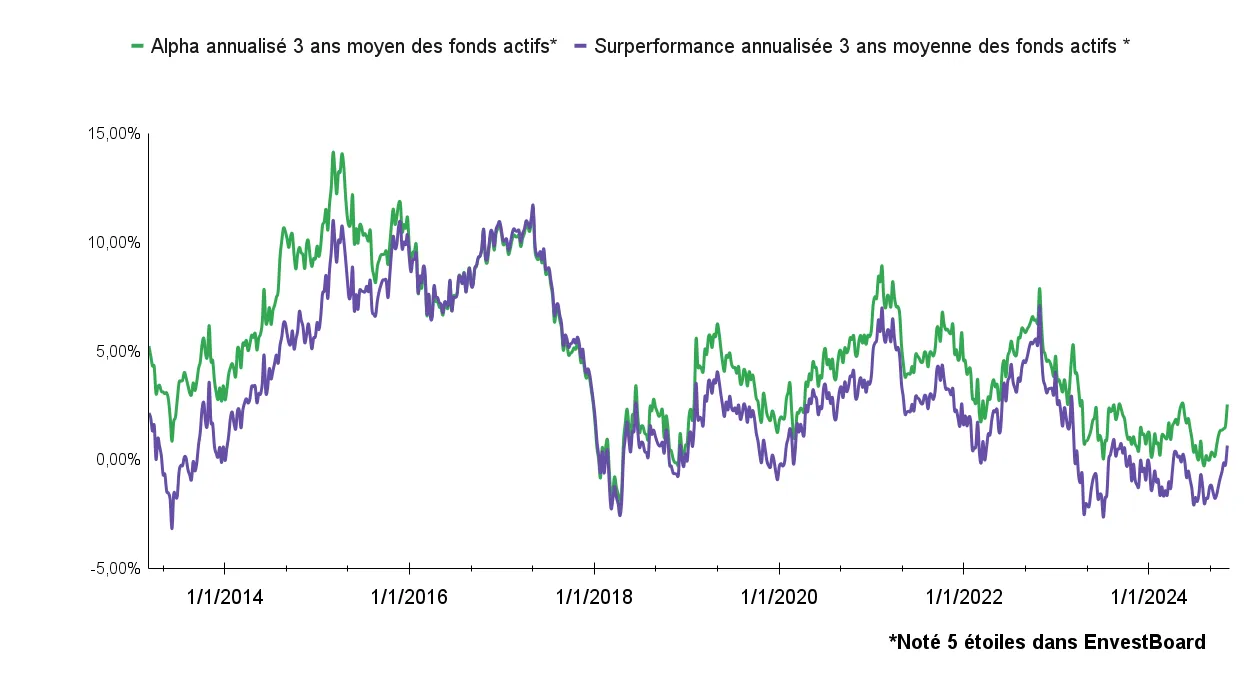
A notable finding: the high correlation (95%) between outperformance and alpha shows that most of the added value from funds comes from effective active management and not simply a leverage effect on the market. These figures demonstrate managers’ ability to generate sustainable performance, adjusted to economic cycles.
3. Beta Evolution: Management Adjusted to Economic Cycles
Beta measures a fund’s exposure to market variations. We observed the evolution of Beta for active funds over the period studied:
- Phase 1 (2010-2016): Beta increase - Managers increased their exposure to the growth factor to capitalize on ultra-accommodative central bank monetary policies, fostering an ideal environment for growth stocks.
- Phase 2 (2017-2020): Gradual Beta reduction - Facing initial interest rate hikes, managers gradually reduced their Beta to limit exposure to increased volatility.
- Phase 3 (2021-2024): Further Beta reduction - In a context of macroeconomic uncertainties, geopolitical tensions, and inflationary pressures, managers opted for a cautious approach, reducing their beta while maintaining sufficient exposure to capture growth factor opportunities.
![]()
These adjustments show that active managers do not simply follow indices mechanically, but adopt dynamic Beta management strategies to adapt to economic and financial cycles.
4. Ongoing Charges: A Barrier Offset by Alpha
Ongoing charges of 5-star active funds
| Median | Average | Max | Min | |
|---|---|---|---|---|
| Ongoing Charges | 0.86% | 0.88% | 1.98% | 0.04% |
The ongoing charges of 5-star active funds range from 0.04% to 1.98%, with an average of 0.88%, compared to 0.40% for the tracker. Although these fees are higher, they have not prevented these active funds from generating excess returns, which average +5.0% over 3 years historically.
Conclusion: Do Active Funds Generate Sustainable Alpha?
For the Global Growth Equities category, the analysis clearly shows that 5-star rated active funds on EnvestBoard have generated significant alpha during the period studied. These results highlight the added value of quality active management, capable of adapting to economic cycles while controlling risks.
However, these conclusions cannot be generalized to all fund categories. Each investor must adapt their analysis based on their investment universe, the commercial availability of funds, and their specific objectives.
Coming Soon: Top Funds Available in France
In our next article, we will reveal the best active funds in the Global Growth Equities category, available in France for your life insurance, PER, and PEA contracts.
EnvestBoard: A Powerful Tool for Granular Analysis
Analyzing and selecting the best active funds can be a time-consuming task. Too often, professionals spend more time processing data or maintaining outdated tools or Excel spreadsheets, instead of focusing on their core business: analysis and investment decision-making.
EnvestBoard revolutionizes this process by offering granular analysis of active and passive funds, through an integrated database covering 200,000 funds and 97% of the offerings available in Europe.
EnvestBoard Rating - 3-Year Outperformance
Each month, funds within the same category are rated based on their 3-year outperformance relative to the category average:
- 5 stars: Top 10% of best-performing funds
- 4 stars: Next 22.5%
- 3 stars: Next 35%
- 2 stars: Next 22.5%
- 1 star: Bottom 10% of least-performing funds
Glossary
- Alpha: Measure of a fund’s market risk-adjusted outperformance.
- Beta: Indicator of a fund’s sensitivity to variations in its benchmark index.
- Sharpe Ratio: Measure of total risk-adjusted performance.
- Ongoing Charges: Annual management cost of a fund, expressed as a percentage of net assets.
About the author: Yufeng Xie is the CEO and co-founder of EnvestBoard, an innovative investment decision-support platform. A graduate of ENSAE Paris with an economics background from the Sorbonne, he has nearly 20 years of experience in asset and wealth management.
Past performance does not guarantee future results. This article is a data analysis and does not constitute an investment recommendation.